What is an Affinity Diagram
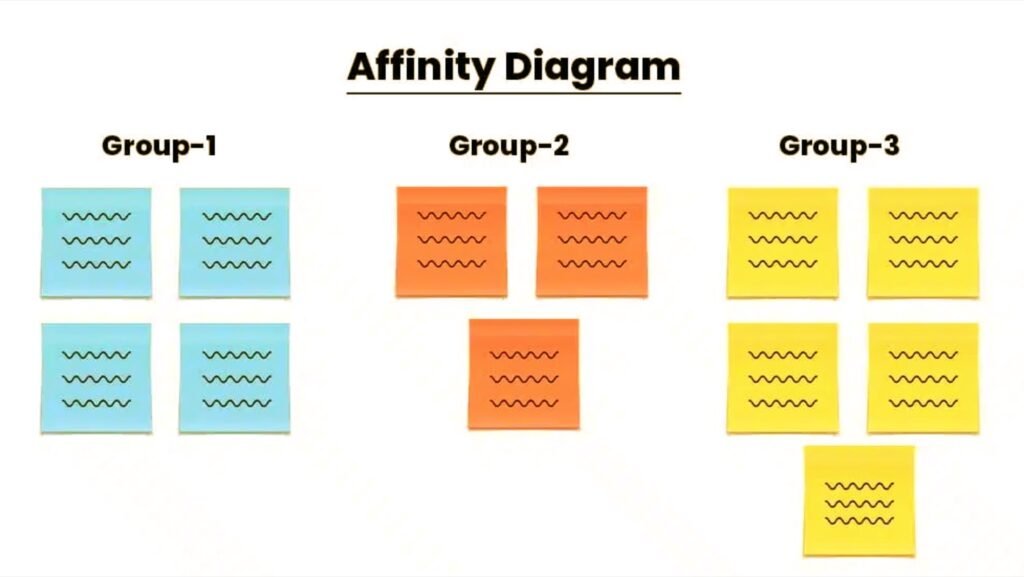
An affinity diagram is a powerful tool used to categorize and organize large volumes of data based on their relationships. This process is especially useful for making sense of insights gathered during research or organizing ideas generated during brainstorming sessions.
Steps to Create an Affinity Diagram
1. Gather Data
Begin by collecting various pieces of data, such as documented facts, drawings, quotes, and observations. Write each piece of information on separate Post-it notes or cards—one item per note.
2. Group Similar Data
Display the notes on a wall or whiteboard, or lay them out on a table. Using Post-it notes is advantageous as they allow for easy movement and rearrangement.
- Start Grouping: Select one note at random to initiate the first group.
- Compare Notes: Take another note and determine whether it shares similarities with the first. Place it in the same group if it does; otherwise, create a new group. Involve your team in this decision-making process to ensure consensus.
- Continue Grouping: Repeat this process, clustering similar ideas together. It’s acceptable to have notes that don’t fit into any cluster, as they can remain isolated for now. Feel free to adjust groupings as you progress.
As you work through this step, you and your team will gain a clearer understanding of the research findings and the overall problem space.
3. Discuss and Refine Clusters
Once you’ve established clusters, take time to discuss each group in detail. Consider the following:
- Clarify and Reorganize: Review any contentious pieces of data and consider moving them to different clusters if needed.
- Label Clusters: Once everyone agrees on the groupings, assign a name to each cluster that encapsulates its essence.
- Connect Related Groups: Optionally, draw lines to connect related clusters and combine them into larger “super groups” if necessary.
Completing this process will leave you with a well-organized set of data, paving the way for further synthesis, problem statement definition, and progression to the next phase of design.
Utilizing Your Affinity Diagram
Once your affinity diagram is complete, you can leverage the organized data for several purposes:
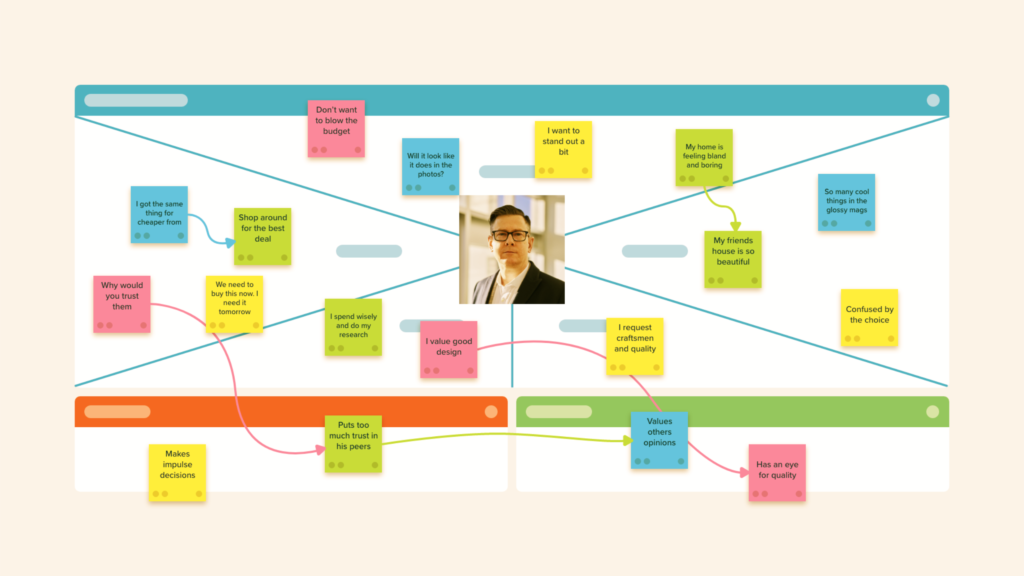
- Empathy Maps: Use the insights to inform the creation of empathy maps.
- Personas: Build representative personas that encapsulate your target audience effectively.
- Synthesis of Insights: Further synthesize the organized data to create clear problem statements.
- Foundation for Ideation: Provide a solid basis for future brainstorming sessions.
Conclusion
Affinity diagrams are an effective method for clustering and organizing a wide range of information, including user insights, research data, and design issues. By following the outlined steps, you can gain clarity on major insights, user needs, and pain points. This organized approach not only enhances your understanding but also lays the groundwork for developing empathy maps, personas, and problem statements, ultimately guiding your design process forward.
